Hydrogen for current PEM and Alkaline fuel cells must be supplied with no more than a few tens of ppm of CO or CO2 respectively. If the hydrogen is generated on-site, as it is used, it must be produced efficiently over a broad fuel cell demand range, and at this high purity in the face of load changes whose time scale is typically on the order of seconds. In this paper, we generated hydrogen for a broad variety of demands from a 1.09/1 molar mix of methanol/water using commercial water-gas shift catalyst in a membrane reactor from REB Research. The reactor output hydrogen was fed directly (dry, unpolished) into a PEM fuel cell from T/J Technologies. Demand was varied between 0 and .9 A/cm2, both in flow through operation (with a bleed) and in dead end operation (without). We show power densities virtually identical to those with bottled gas, and better when operated in dead-end mode. We also show inherent load following where back-pressure in the fuel cell affects the membrane reactor hydrogen output on a time scale ¾ 2000µs.
BACKGROUND:
Fuel cells in 1 W to 100 kW sizes are being considered for near term service in several remote and mobile applications where they provide critical advantages of quiet operation, reliability and (potentially) high energy density (Whrs/lb): advantages that justify the current high price of fuel cells. An open question though, is where the hydrogen is to come from. This is a particularly pressing question where weight is a premium and the loads must vary, as in military, boating, camping, automotive and back-up power. Hydrogen delivery for these applications must be high density (energy/weight „ 1 Watt hr/gm) and must follow a varying load with only a few minutes lag at most. The hydrogen must be delivered relatively pure, containing a few tens of ppm CO or CO2 respectively, depending on whether the fuel cell is based on acidic Polymer Electrolyte Membranes (PEM) or on Alkaline solvents. Direct methanol PEM fuel cells are an attractive, longer range PEM option, but current designs appear to lag hydrogen fed PEMs in efficiency, cost and delivered power density.
Small scale generation of hydrogen appears to require more than a scaled down version of large hydrogen plants; miniature petrochemical designs cost and weigh too much per unit of hydrogen output (1). Further, load following purity is poor and energy loss due to heat shedding, and for control and startup / shutdown consumes too large a fraction of the potential power (2). A recent paper on autothermal reforming and partial oxidation purification (3) showed that it this design, too, could not maintain <25 ppm CO concentrations with a varying load. In this paper we have generated hydrogen using membrane reactor steam reforming, a technique, developed over the past few years at REB Research. As a hydrocarbon feed to the reactor, we used a nearly stoicheometric mixture of methanol and water. We fed the hydrogen output of the reactor directly into a T/J Technology PEM fuel cell to test predictions that hydrogen purity and fuel cell electric output are inherently maintained over a varying load.
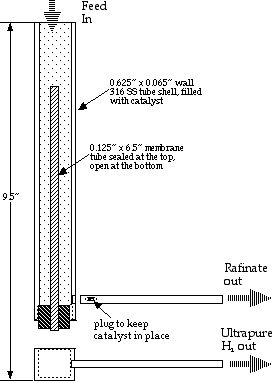
The membrane reactor design used in this study is shown in schematic in Figure 1, and is described previously (4,5). In the reactor, the methanol water mixture is converted to hydrogen over conventional water gas shift catalyst (CuZnO from Sudchemie) via the following reaction:
CH3OH + H2O --> 3H2 + CO2.
What makes the membrane reactor unique is that, while hydrogen is formed, it is extracted through metal membranes within the reaction zone. Hydrogen removal in the reaction zone drives the reaction further to completion than it would in an ordinary reactor, and increases the effective catalyst activity by increasing the reactant concentrations and residence times.
In this reactor we used REB Research’s palladium-coated metal sandwich membranes that are effectively 100% selective to hydrogen. This membrane choice should insure that any hydrogen that passes the membrane is >99.9999% pure independent of any hydrogen back-pressure changes caused by varying fuel cell demand. The delivered purity should be higher than of bottled hydrogen. We wanted to see if this would result in an exceptional power curve from the fuel cell, that is a voltage versus current density curve exceeding that for operation with bottled hydrogen.
We also hoped to be able to run the hydrogen into the fuel cell in dead-end mode, that is without the typical, periodic bleed of hydrogen from the fuel cell. Normal reformer hydrogen contains significant quantities of CO2, CO and unreacted fuel which has to be bled from the fuel cell at a rate that is proportional to the power use, and even bottled hydrogen generally requires hydrogen is bleeding at regular intervals to prevent impurities from building up in the fuel cell. In our membrane reactor the non-hydrogen components are supposed to exit separately from the hydrogen, via the rafinate stream in Figure 1. Dead end operation should be more efficient since all the feed hydrogen is used to generate power. Further, dead end operation should eliminate the need for proportional bleed control and valving that adds weight and robs power from the fuel cell. Finally, dead end operation should make hydration and voltage control easier since there is not a periodic drop in pressure unrelated to power draw.
Membrane reactor hydrogen, especially in dead end mode, should result in inherent, instantaneous load following. Because the off-gases and impurities exit at constant pressure separately from the hydrogen, a change in hydrogen demand changes only the hydrogen pressure at the fuel cell. This change feeds back through the membrane to affect hydrogen partial pressure in the reactor altering the rate of reaction and the composition of the exhaust gas. The greater the hydrogen demand, the faster the reaction and the leaner the exhaust gas, with changes occurring on a time scale that should be determined by the speed of sound in hydrogen.
One of the authors, REB, has postulated that the preferred heating mechanism for a membrane reactor is to burn the waste gas (4,5), supplementing this with combustion of raw feed. The waste gas should be flammable, containing some 25% of the hydrogen generated. Burning this waste increases the thermal efficiency; it recycles heat value and can result in thermal efficiencies in excess of 90%.
EXPERIMENTAL:
The reactor was fed with reagent grade methanol (Aldrich inc.) mixed with a water purchased at the local supermarket (Absopure® Steam Distilled Drinking Water) to form a 1:2 by volume water methanol mixture, equivalent to 1.09 mol H2O/mol CH3OH. The slight excess of water over the 1 :1 molar ratio in Equation 1 is thought to be beneficial to prevent coking. The methanol-water was mixed before the beginning of any experiment and held in a polyethylene holding tank. A medical dosing pump (Pulsatron inc.) took the methanol-water from the holding tank and fed it to a boiler and then to the reactor at a constant flow rate 1 cc/min. +/- 5%. Pressure in the reactor was maintained by a check valve (Swagelok) on the off-gas stream set to 265 psi, and was measured by a (US Gauge) pressure gauge ± 5 psi accuracy.
Before entering the reactor, the methanol water was passed through a boiler made of 1/8” diameter coiled copper tube, 5 feet long, wrapped around the reactor. Wrapping the boiler tube around the reactor this way was done for convenience; it helps match the boiler temperature to the reactor temperature, and eliminates the need for a second controller and heater loop. Both the boiler and reactor were insulated on the outside with ceramic insulation (Zirtek, inc.) covered with aluminum foil.
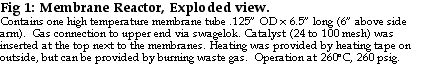
Hydrogen production upstream of the fuel cell was measured by a mass flow meter from Aalborg calibrated against a bubble flow meter. Exiting hydrogen passed a check valve (Swagelok) set to 1 psi to prevent hydrogen suck-back in the event of an unplanned shut-down. After passing the reactor check valve, waste gas entered a knockout drum to collect liquids, water and unreacted methanol. From there, vapors exited the system through a third check valve set at 1 psi. A room CO detector (Nightingale, Inc.) was used as a safety measure to indicate that minimal CO exited with the waste gas. We show the combination of reactor, boiler, and pump, along with its flows in Figure 2; for brevity, we refer to it as the Me100 because it combines a Methanol -reformer and a 100% selective membrane.
Hydrogen from the Me100 was fed directly, dry, into a T/J Technology fuel cell with 5 cm2 active area operated at 50°C. The fuel cell membrane was Nafion 117 coated with TJ-PtRuMo/C catalyst, 0.53 mg/cm2, at the anode and a Pt/C catalyst, 0.48 mg/cm2, at the cathode. Oxygen flow was maintained at 0 psig and 100 ml/min. throughout. For comparison tests hydrogen flow from a hydrogen bottle (Airgas) and from the Me100 reactor was maintained at 85 ml/min. by use of a software controlled adjustable bleed, controlled by Alltech Associates,Inc. Mass flow controllers. We used dry hydrogen throughout and chose this low operating temperature to make the tests more sensitive to CO poisoning and at the same time more typical of the likely feed to current portable fuel cells. Humidification might also have added to the variability to the experimental results as humidification history affects nafion membrane aging. With the controlled bleed, the hydrogen pressure was about 0 psig at the fuel cell, both with the Me100 and the bottled hydrogen source.
A latter test was run in dead-end mode with the membrane reactor hydrogen. In this mode of operation, the hydrogen flow rate is controlled by hydrogen demand at the fuel cell, and the hydrogen pressure is allowed to vary. No effort was made to adjust the methanol-water feed to match the hydrogen demand, and as a result the hydrogen pressure increased at low amperage, rising as high as 25 psig. We measured the power curves, shown in Figure 3 as voltage vs current density, using a PC controlled Scribner 890B Fuel Cell Test Station. The power curve experiment sequences took approximately 20 minutes each, and so provided a first demonstration of load following.
RESULTS:
We found a startup time on the order of 5 minutes. At operating temperature, the temperature varied along the length of the reactor by 50-60°C with the maximum in the middle. This variation is more than could be explained by the heat of reaction and the heat of boiling given the high thermal conductivity of the copper boiler tube. Further, if this variation were caused by endothermicity, the temperature should have been a minimum in the center of the reactor if the membrane reactor, as predicted by Amphlett et al. (6). We tentatively attribute the temperature gradient to heat loss at the ends of the reactor. At these operating conditions with the sudchemie catalyst, the Me100 produced a maximum of 150 cc/min. of hydrogen, or enough to generate 30 amps in a fuel cell. Depending on the pump rate, the off gas could be made flammable or not, but no effort was made to use heat from burning the waste gases to heat the reactor.
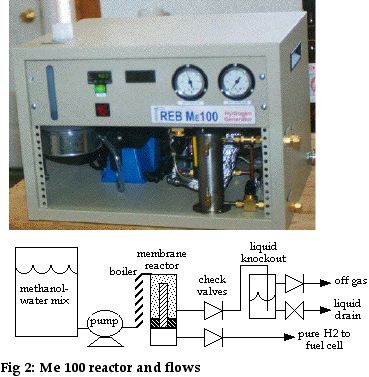
The voltage versus current density observed with this reformer and fuel cell is shown in Figure 3. The results with bottled hydrogen set to 0 psig using the bleed are shown in black, those with membrane reformer hydrogen set to 0 psig using the bleed are shown in red, and those with reformer hydrogen in dead-end mode (no bleed, varying pressure) are shown in blue. We performed several runs with bottled hydrogen and reformer hydrogen because there was considerable scatter in the performance curves, especially at the start with the bottled hydrogen. This scatter is typical of operation with dry hydrogen, and relates to membrane conditioning / hydration - dehydration effects. The power output is consistent with previous measurements on this fuel cell at 50°C with dry hydrogen in constant bleed mode.
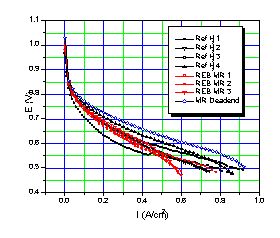
Figure 3. Performance curve with non humidified bottled H2 and non humidified REB Me100 membrane reactor H2 in a T/J Technology PEMFC at 50°C, iR corrected.
Figure 3 shows that the performance with bottled hydrogen (black lines) is virtually identical to that with membrane reactor hydrogen (red lines). Studies at the Royal Military College (7) using Ballard fuel cells show a nearly 75% decrease in power density for even 10 ppm CO and results with T/J fuel cells fed impure hydrogen (unpublished) are similar. Figure 3 shows a slight fall off in voltage with the membrane reactor hydrogen at high currents, but the dead-end performance suggests this may be due to mass transportation differences between the bottle and the reformer. That is the hydrogen bottle maintains hydrogen pressures better at high fuel cell demands. The Me100 hydrogen pressure in flow through mode is probably lower than that delivered by the cylinder.
The fuel cell power curve with membrane reactor hydrogen in dead-end mode is uniformly higher than with either reformer or bottled hydrogen with a bleed. Dead end operation is generally not used since it tends to concentrate any impurities in the hydrogen feed. The high observed voltages, especially at middle and high current densities suggests that our reformer hydrogen is essentially 100% pure. That the voltage is higher with reformer gas in dead end mode that with cylinder gas and reformer gas in flow through mode is pressure related, at least partially. In dead -end mode, the Me100 hydrogen pressure varied with the load and rose as high as 25 psig at zero flow. Generally, fuel cell voltages increase with higher hydrogen pressures. Other possible contributors to the increased power curve in Figure 3 include increased hydrogen humidity as water is not swept from the system with the bleed. Whatever the explanation, dead-end fuel cell operation seems preferable with membrane reactor hydrogen, at least with this type of fuel cell. Dead-end mode might have produced less power had significant amounts of impurities transversed the fuel cell membrane either from the air side or the hydrogen side. Low permeation appears to be typical of nafion membranes like those used here (8), but is not with all the alternative membranes currently under development.
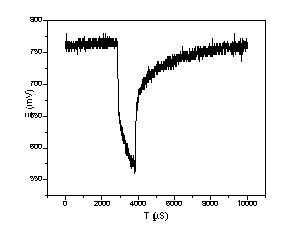
Figure 4. Voltage response of T/J PEMFC powered by REB membrane H2 generator at 50°C. The current pulsed from 0.1A to 1A with 100 Hz and 10% duty cycle, no iR correction.
The experiments in Figure 3 had a cycle time of about 15 minutes, and did not show a clear loss of voltage versus steady state; that is it showed load following at this time scale. To measure fuel cell response at higher cycle times, an experiment was performed where a HP load bank, HP 6060B, was changed between .1 amp and 1 amp over 1 millisecond (1000µs) with a cycle that repeated over 10 ms. The voltage with membrane reactor hydrogen in dead-end operation, is shown in Figure 4 as observed through a Tektronix TDS 210 oscilloscope. The load amperage changes from .1 Amp to 1 Amp at about 3000µs, and changes back to .1 Amp at 4000µs. For the 5 cm2 fuel cell, this is the equivalent of a change between .02 A/cm2 and .2 A/cm2, and based on Figure 3, we expected steady state voltages of .85 V and .72 V respectively. The voltages observed in Figure 4 are somewhat lower, .77V at ‘steady state’ and .02 A/cm2 . At 3000µs (.2 A/cm2) the, voltage dropped to .65V and subsequently went as low as .575 V and falling by 4000µs. The steady voltage difference between Figures 3 and 4 seems mostly due to the lack of iR correction in the transient experiments, but the capacitance effect of transient charging the double layer in the fuel cell may have played a role too. Full voltage recovery at .1 amp occurred at about 6000 µs, 2000 µs (2 ms) after the initial change, suggests that the time scale for the voltage recovery in the reformer - fuel cell system is 2000 µs. This is good enough for most applications, and is much faster than is likely for load following with any non-membrane reformer considered to date (3). Fast response minimizes the need for capacitors (9) and makes it easier to design control systems to maintain high efficiency and purity.
Future Directions:
The set-up used here is suited only for laboratory use and does not take advantage of the complete power of the membrane reactor for mobile and remote hydrogen generation. As shown in Figure 2, only manual adjustment of the methanol/water flow rate was available. further, heat to the reactor was provided electrically, instead of by combustion of waste gas as in Buxbaum (4). The next step for REB Research will be to heat the reactor by methanol water combustion, and after that, to heat it mostly from waste gas combustion. At steady state, burning the waste gas to heat the reactor should provide system efficiencies over 90% of the lower heat value of the methanol-water. Future work will also explore different temperature control schemes to see how combustion heating affects the way a fuel cell fed with reformer hydrogen follows a changing electrical load. These experiments suggest there will be no problem controlling hydrogen output if reactor heating is provided by methanol combustion, since this should be similar to electrical heating.
With an appropriate methanol burner, the time scale for reactor heating can be on the order of minutes as seen here during start-up. Even a simple controller should have no problem at this time scale. Controllability may decrease when heat comes from waste gas combustion since changes in the partial pressure of hydrogen in the reactor (as in response to changing power demands) will result in simultaneous changes in the heat value of the offgas and in the heat demand of the reactor. We are optimistic that we can find a control scheme that gives stable control and high efficiency over a broad range of turn down, but we have yet to pick a control strategy or to determine the ideal ratio of thermal inertia to heat rate for the reactor. One buffer to immediate changes in the hydrogen partial pressure is hydrogen absorption in the metal membrane and catalyst. This buffer should promote stable control, insuring that the exhaust gas will not become suddenly non-flammable in response to a spike in fuel cell power demand.
One control scheme we are considering is to use a pressure sensor within the hydrogen output to control the methanol/water pump delivery rate, adjusting the methanol feed to maintain a hydrogen output pressure of say 10 psig. Our idea is to maintain the reactor temperature at a constant pressure (about 260 psi seems appropriate) by exhausting waste gas, as done here. Our thought is to send all the waste gas to the burner as in Buxbaum (6), and to turning on raw methanol-water combustion only when this does not suffice to maintain the reactor temperature within a desired range, or perhaps when the exhaust from combustion leaves at too low a temperature. Another thought is generally controlling the reactor temperature by the methanol-water pump rate. A third control scheme is to drive the methanol water pump directly from the mechanical energy within the waste gas, using a non-electrical steam-water pump of the sort that is sometimes used to provide feed water to steam engines. This last method removes an energy inefficiency inherent in using electricity to pump the liquid feed when plenty of pressure volume energy is available for free in the waste gas. This pump is likely to make the overall design lighter as well, but it may make it less controllable.
REFERENCES:
1. J.C. Amphlett, K.A.M. Creber, J.M. Davis, R.F. Mann, B.A. Peppley, and D.M. Stokes, “Hydrogen Production by Steam Reforming of Methanol for Polymer Electrolyte Fuel Cells”, Int. J. Hydrogen Energy, 19 (1994) 131-137.
2. B. Lakahmanan, W. Huang, and J.W. Weidner, “Electrochemical Filtering of CO from Fuel Cell Reformate “, Electrochemical and Solid State Letters 5 (2002) A267-270.
3. B. Emonts, J.B. Hansen, et. al., “Operational Experience with the Fuel Processing System for Fuel Cell Drivers”, J. Power Sources 106 (2002) 333-337.
4. R.E. Buxbaum, “Membrane reactors for methanol reforming and similar reactions” Separation Science and Technology 34 (1999) 2113-2123. (Click here for a draft version of this paper)
5. R.E. Buxbaum, “High Temperature Gas Purification Apparatus”, US patent, No. 6,168,650, Jan. 2, 2001
6. J.C. Amphlett, L.M. Kearns, R.F.Mann,B.A.Peppley, and J.P.Salvador, “The Simulation of a Membrane Reactor for Generating hydrogen from Methanol for a PEM Fuel Cell System.” Hydrogen Energy Progress XII, J.C. Bolcich and T.N. Veziroglu,eds. (The Int’l. Assoc. for Hydrogen Energy, 1998)
7. J.C. Amphlett, R.F.Mann, and B.A.Peppley, “Onboard Hydrogen Purification for Steam Reformation/PEM Fuel Cell Vehicle Power Plants,” Int. J. Hydrogen Energy, 21 (1996) 673-678.
8. S. Gottesfeld “Polymer Electrolyte Fuel Cells”, Advances in Electrochemical Science and Engineering, R.C. Alkire, Hgerischer, D.M. Kolb, and C.W. Tobias (Eds.), Wiley-VCR Verlag Gmbh D-69469 Weinhein, Germany (1977) 195-301.
9. D. Tarnowski, H. Lei, C. Peiter, and M. Wixom “Response of Hybrid Power Supplies Combining Ultracapacitors with Direct Methanol Fuel Cells,” 2001 Joint International Meeting- 200 th Meeting Electrochemical Soc., and 52nd Annual Meeting Int. Society of Electrochemistry, http://www.electrochem.org/meetings/past/200/abstracts/symposia/b1a/0080.pdf